Nate Stringham

school University of Utah '21 - present
school Pomona College '20 - B.A. Math
location_on SLC, UT
email nates [at] cs [dot] utah [dot] edu
About
Peaks
GitHub / LinkedIn
Simulating a NCAA DIII National XC Meet
Ethan Ashby, Danny Rosen, Nate Stringham
This project was completed for Math 154 - Computational Statistics in Fall 2019.
All race data was obtained from tffrs
See also
- a simulation applet
- the slides we made for our presentation
- an in depth discussion of methods and results
Goals
- Successfully simulate a national championship meet using prior race results.
- Analyze these simulations to assess how well different college programs “peak”
Background
In NCAA Division III Cross Country, runners compete in an 8k race with the top 5 finishers from each team contributing to the overall team score. Specifically, a team score is calculated by taking a sum of the places of the top 5 finishers from each team. The team with the lowest score wins the meet.
Each year every team in NCAA DIII vies for one of 32 spots in the National Championship Meet. Those that qualify send 7 runners to compete in this meet for the title of national champions. Many teams structure their training plan in an effort to ensure that their fitness is highest immediately leading up to this meet through a process colloquially referred to as peaking. While methods vary across coaching staffs and teams, the ability of a cross country program to peak its runners well at the end of the season is often what determines national champions. By simulating a meet and comparing the simulations to both the pre-meet rankings and the actual results we hope to gain insight into which programs actually peaked at the national meet.
Method
To run the simulation, we first standardize the times run at various races leading up to the national meet for each athlete on a qualifying team. These adjusted times from the current season are used to create a normal distribution for each athlete; then, to simulate a national meet we simply sample from each athlete’s distribution to get their national meet performance. These results can then be scored as a cross country meet. We compare the actual nationals result from that year to our simulated result to determine how well a team peaked. We assign a score to each program based on how consistently they peaked at the national meet and how far they exceeded our simulated expectation of their finish at the national meet.
Some Results
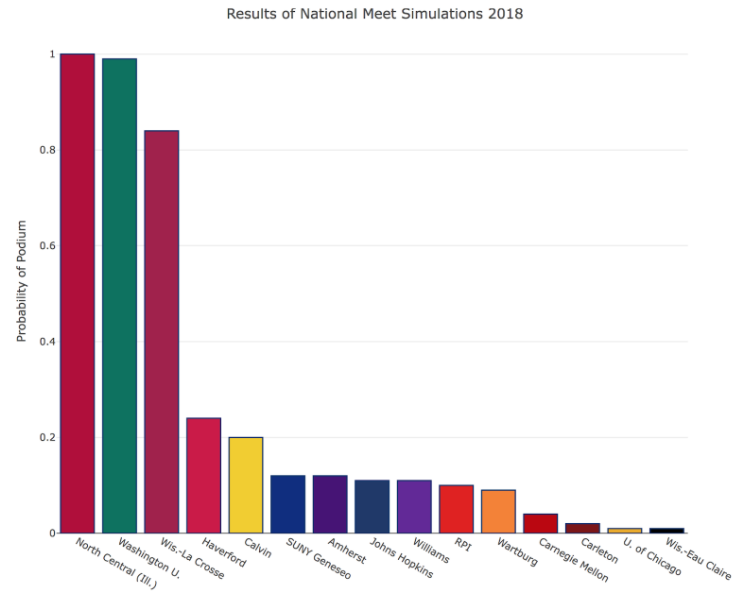
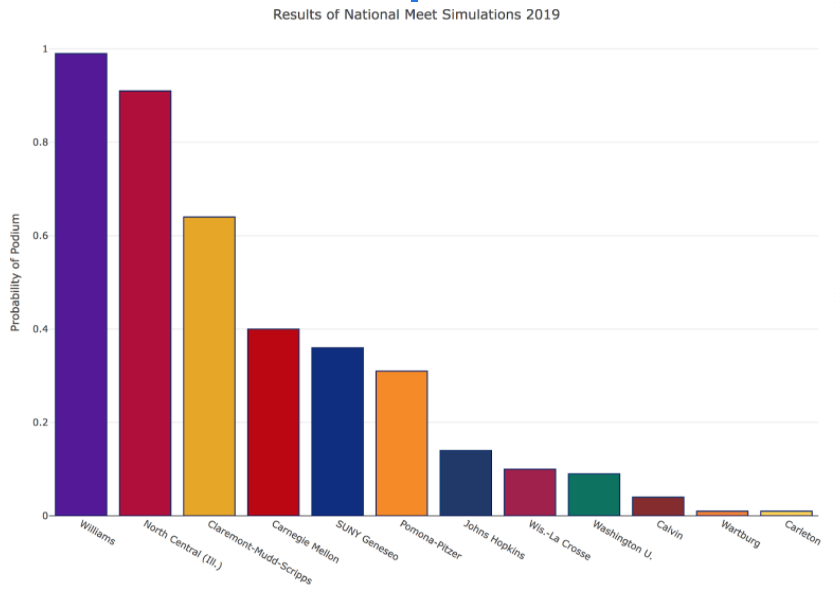
We performed this process of simulating for both the 2018 and 2019 seasons. The plots below show our predicted probability for a team to finish on the podium (top 4) at the national meet.
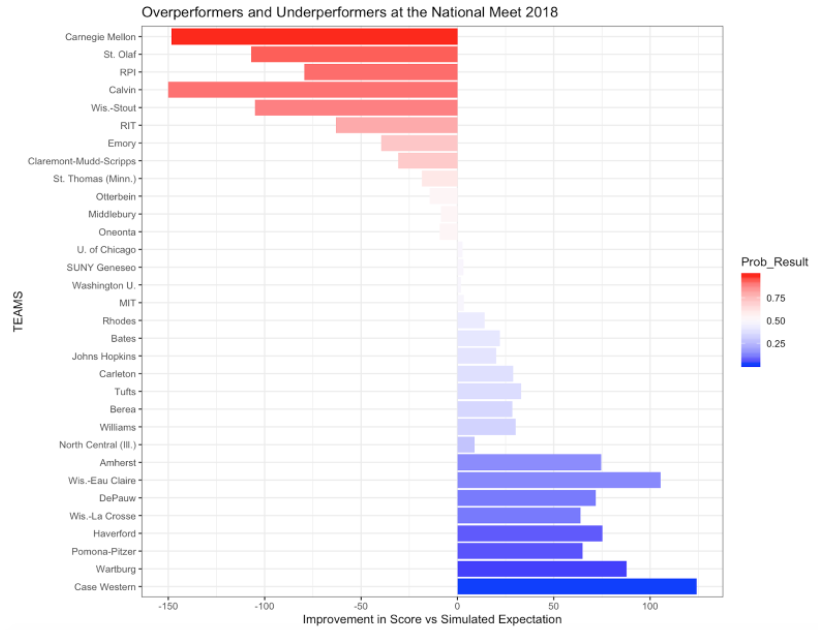
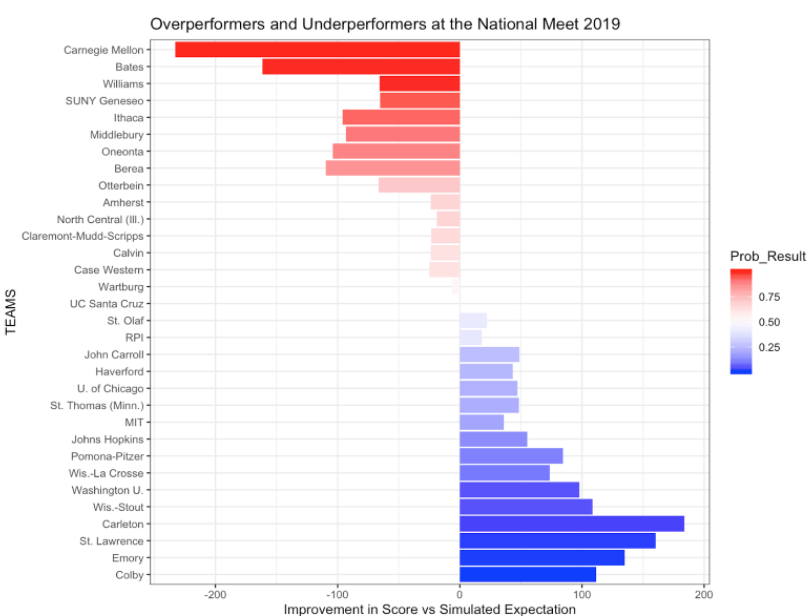
By comparing these predictions to the actual results of the meet, we produced the following plots illustrating over-performers and under-performers from the meet.
For a more in depth discussion of methods and results, see here
2024
- Oliver Bentham*, Nathan Stringham*, and Ana Marasović. Chain-of-Thought Unfaithfulness as Disguised Accuracy. Transactions on Machine Learning Research. URL
- Ashim Gupta, Rishanth Rajendhran, Nathan Stringham, Vivek Srikumar, Ana Marasović. Whispers of Doubt Amidst Echoes of Triumph in NLP Robustness. In Proceedings of the 2024 Conference of the North American Chapter of the Association for Computational Linguistics: Human Language Technologies (Volume 1: Long Papers), pages 5533–5590, Mexico City, Mexico. Association for Computational Linguistics. URL
2023
- Tianyu Jiang, Sonia Vinogradova, Nathan Stringham, E. Louise Earl, Allan D. Hollander, Patrick R. Huber, Ellen Riloff, R. Sandra Schillo, Giorgio A. Ubbiali, and Matthew Lange. Classifying Organizations for Food System Ontologies using Natural Language Processing. The Integrated Food Ontology Workshop (IFOW 2023). URL
2020
- Nathan Stringham and Mike Izbicki. Evaluating word embeddings on low-resource languages. In Proceedings of the First Workshop on Evaluation and Comparison of NLP Systems, pages 176–186, Online, November 2020. Association for Computational Linguistics. URL